Although building my own DIY oscilloscope was fun, I had always wanted to get a real one. A few months ago I decided to buy a used one on Yahoo auctions. In particular, it was an Iwatsu BRINGO DS8812 digital oscilloscope (DSO).
Although there were good oscilloscopes for lower prices, the DS8812 fitted all my requirements:
- Cheap (10,000yen, about 78 euro).
- Small size, because my workspace was getting full of devices.
- Enough bandwidth, channels, sampling rate and memory length.
- DC~100MHz, 2 Channels, 500MS/s, 100kword/channel
- A remote control protocol (through RS-232C) that was documented.
The only problem that this oscilloscope had, and the reason for its low price, was that the right menu was hard to see. I tried disassembling the oscilloscope and touching different connections but I wasn't able to improve it. For that reason, I decided to create a GUI interface to control and visualize the oscilloscope remotely through the RS-232C interface.
In order to control the oscilloscope, a cross serial cable was required. In my case, I already had a straight serial cable so I only had to buy a null-modem converter which worked great.
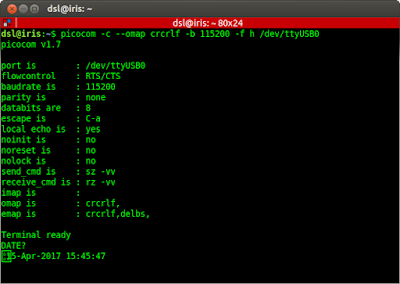
 $ picocom -c --omap crlf -b 115200 -f h /dev/ttyUSB0
    --omap crcrlf: outputs CR/LF instead CR (set osc to CR/LF delimiter)
    -h: enables RTS/CTS
    -c: local echo
The most tricky part was passing the appropriate parameters to the serial terminal. Picocom is my favourite serial terminal, and these are the parameters I used.
With that in place, I finally managed to get a response from the oscilloscope using the command "DATE?" (commands that end with a question mark represent requests to the oscilloscope).
I programmed the frontend using PyQT (Python bindings for the QT GUI library). I found the QT designer to be particularly easy to use and robust. The source code is on my github account and it uses pyserial for communicating with the oscilloscope, and matplot for displaying waveforms.
Here is a snapshot of two square waveforms on each channel. The app is not very sophisticated but it does its job and can be easily extended in case I need more functionality.
For example, here I implemented an FFT view of the acquire waveforms. This was a paid functionality on the original oscilloscope.
Conclusions: I'm glad that I got a oscilloscope that I could controll remotely. Now I can easily store waveform data, analyze it or save it as an image file. I really enjoyed working with PyQT and the QT designer. They are very powerful and easy to use. Last but not least, I summarized my "endeavour" in a few slides and presented this project at OSunC in Kawagoe.


No comments:
Post a Comment